6 Project and data management
6.1 Project management
6.1.1 Project directory structure
The lab uses a consistent project management style to facilitate collaboration across members and to facilitate the open dissemination of our work. To participate in data analysis or manuscript preparation, you will need to organize the files on your local computer with a particular structure to match the lab’s structure. If you do not have one already, you should create a projects or research or CCHIL work directory on your computer. We highly recommend creating this directory with your Microsoft OneDrive folder on your computer.
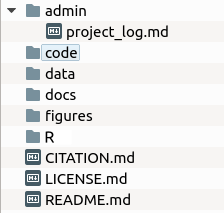
Once you have an overall projects directory in place, you can create a subdirectory for the current project. Within the project directory, you will want to use the following subdirectory structure:
adminThis is the administrative directory that should contain information about IRB protocols, IACUC protocols, pre-registration documents, experimental protocols, and other files associated with the logistics of the project. It also has a file calledproject_log.mdthat is a log of the event associated with the project.codeThis is the directory for the computer code that is used to collect data. For example, there might be Python, PsychoPy, or OpenSesame code here. Not all projects have a code directory.dataThis is the directory that stores the project data. Often there is a subdirectory calledraw_datafor raw data.docsThis is the document directory that stores the files for manuscripts and presentations (posters and talks). This is where mostRmdfiles go. We do not place administrative documents here—only documents for disseminating our results.figuresThis is the directory for hand-drawn and script-generated figures.RThis is the directory that contains the data analysis scripts. In general, there should be a data processing script and a data analysis script.CITATION.mdThis file gives the citation for the published version of the project (e.g., journal citation).LICENSE.mdThis file describes the license under which the project is published (e.g., Creative Commons Attribution 4.0 International Public License).README.mdThis file give a short overview of the project and is the landing page for the project on GitHub.
In general, use subdirectories to organize the main directories and limit the files in the main directories to just the core files. We will often create old subdirectories to move old or irrelevant files into.
6.1.2 Existing projects
Most projects in the lab already have project directories, and they are available to collaborators in the lab. These directories are available as Git repositories (repos) at GitHub, a website that stores, backs up, and version controls code. Git is a very powerful tool for tracking changes that happen to files, and GitHub is a great way to facilitate online collaboration. Briefly, GitHub allows you to clone (install new) existing repos from the remote GitHub source to your local computer, pull changes from a remote repo to update your local repo, and push changes you make locally up to the remote repo. Check out Github’s glossary for more definitions. To learn more about working with Git, check out the Version control section.
So if you want access to the project directories, you need to create a GitHub account and send Jeff your GitHub account name. Once you’re added to the lab team as a contributor, you can clone the repo locally to your own computer and start working on the files.
Note that GitHub does not automatically sync your computer with the remote repo. This is done for two reasons: (1) multiple people can be working on a file at a time, which can cause conflicts and (2) project manager may want control over what changes are accepted and rejected. Therefore, you must manually pull changes from the remote repo that other people have pushed there. Please always pull from the remote repo everytime before you start working on a project. Also, when you make changes to files on your local repo, you must manually push them to the remote repo. In some cases, your pushes will be automatically accepted. But in other cases, your pushes must be reviewed by the repo maintainer to make sure that they are acceptable.
6.1.3 RStudio Projects
Because most of our analyses and documents are done in RStudio, we use RStudio Projects for our projects. Creating an RStudio Project sets the working directory in RStudio to the project’s root directory. This is useful because when you open an RStudio Project, you always know what working directory you are using. Combined with the functionality of the here() function of the {here} package, you will not have to spend any time worried about setting directories with an RStudio Project.
RStudio Projects also will automatically open the documents that were opened last time that you used the Project. Finally, you must work in an RStudio Project to be able to use version control via Git in RStudio.
So you should create an RStudio Project for every project that you will be using RStudio for. To open the RStudio Project, double click on the .Rproj file in your project root directory (do not open RStudio through the app menu).
6.2 Project workflow
The way in which we manage our project workflow can (1) maintain consistency and facilitate collaboration across the lab, (2) ensure more robust scientific practices, and (3) encourage open science and facilitate publishing our work in a reproducible way. Therefore, the lab uses consistent tools and steps to maintain a reproducible project workflow. In general, our lab
- pre-registers our studies,
- collects data in an open manner (using open-source software when possible),
- archives raw data without alteration,
- uses R to process that raw data,
- generates ‘working data sets’,
- uses R to analyze working data to calculate descriptive statistics, conduct statistical tests, and generate figures,
- uses R Markdown to produce manuscripts and presentations to disseminate our work,
- posts our data collection materials, working data sets, R analysis scripts, and R Markdown documents with our published articles.
This workflow needs to be in place for all CCHIL lab members. However, the workflow is not immutable—if you have suggestions on ways to improve it, let Jeff know. Though imposing our structure on collaborators is not feasible, we will try to maintain our project workflow as much as possible with people outside of the lab.
6.2.1 Pre-registration
One way to improve replicability of our studies is to pre-register them (Nosek et al. 2019). Pre-registration means that you write down and post your plan for methods, data collection, data processing, and analysis before starting data collection. Pre-registration forces you to think about how you will analyze your data before you have any. This both helps in designing your data collection tools and limits the degrees of freedom available for p-hacking at the analysis step.
There are a number of different ways to pre-register a study. This simplest is to complete the nine-question form at AsPredicted.org. Alternatively, the Open Science Framework pre-registration system provides a more thorough avenue to pre-register your study. I highly recommend using the {prereg} package to create your pre-registration in R Markdown before submitting. However you choose to do so, you will need to pre-register your studies before starting data collection.
6.2.2 Data collection
When designing data collection tools (e.g., Qualtrics surveys, PsychoPy scripts, etc.), it is important to think about how the data will be used downstream in the work flow. So before designing data collection, make sure to understand the rest of the workflow and think carefully about how the information you collect will be used in the workflow. Take the time to carefully design these tools to facilitate easier data analysis.
Standard practices for data files
- Organize data files logically and separate them into subdirectories if appropriate.
- Save data files as
csv(comma-separated value) files. In general, use plain text files (txt,md) as much as possible. Avoid using Excel and Word files when possible. - Name files consistently. In general, ‘snake_case’ (that is, lower case with an underscore between words:
response_time) works best. Avoid uppercase letters and spaces in file names. If possible, use a script to automatically name files consistently. If appending a date, use proper ISO standard dates: YYYY-MM-DD (e.g.,my_file-2020-05-22.csv) - Within data files, use descriptive variable names written in snake_case. Abbreviations are acceptable, but make sure that they are readable and understandable. Do not use upper case letters or spaces in variable names.
- Think carefully about how the data values should be labeled, considering how you will be working with those values in R. For instance, avoid using spaces in value labels (use snake_case when possible). For example, do you want to use words (e.g., Yes/No, LL/SS) which are more descriptive or numbers (e.g., 1/0) which can be used to calculate proportions directly?
- Use the proper ISO standard for dates and times: YYYY-MM-DD hh:mm:ss (e.g., 2020-05-20 09:48:00) or just YYYY-MM-DD for dates.
- Avoid collecting identifiable data when possible. And ensure that you are only collecting data that you have IRB permission to collect. For instance, in Qualtrics, unless you requested permission to do so, you must disable the recording of particpant IP address (Survey Options > Security > Anonymize Response).
Data security
In addition to attending to the structure of data collection, take the time to ensure data security.
- Only store data files on password-protected computers. If you must use shared computers, transfer the data files to OneDrive, double check that they are all uploaded to OneDrive, delete them from the shared computer, and empty them from the trash. You cannot store data with personally identifiable information on personal computers. They can only be stored on lab computers.
- Do not leave publicly accessible computers unlocked. For example, if you are working in the B71 bullpen or the library or a coffee shop, do not leave your computer unattended and unlocked. Lock your screen.
- Do not share any lab passwords outside the lab, and do not leave passwords visible to others.
- Do not upload data (especially participant-related information) to any cloud storage systems besides OneDrive (e.g., not Google Drive). We only have permission to store data in OneDrive.
- Do not make or use public GitHub repos until all data analyses are public, and the PI has authorized making the repo public.
6.2.3 Raw data
All raw data should either be automatically saved to a cloud storage service or should be moved there as soon as possible. Currently, the lab uses OneDrive to store all raw data, and each project should have its own OneDrive folder that is shared with all of the project members. Note that OneDrive raw data folders do not necessarily have to be synced onto your local computer.
Note that we are using OneDrive as an archive for all raw data. That means that all raw data need to be archived on OneDrive, even if it is a ‘bad’ data file (e.g., incomplete data, interrupted session, wrong subject/date entered, etc.). If necessary, a subdirectory for ‘bad’ data can be created and these files can be moved there. But every data file created must be archived on OneDrive.
Because this is an archive of the data, we do not EVER alter the raw data files, including the file names. Any changes that need to be made to data must happen downstream in the R scripts. Raw data should never be changed. If changes need to be made, they need to be entered into the project_log.md file and a separate notes file (if desired).
OneDrive files are versioned (meaning it saves previous versions) and authored (meaning we can see who made changes). So we can revert to previous versions, but this should not need to happen. Do not change raw data files.
6.2.4 Data processing
In the lab, all data processing occurs transparently via R. Never change any data files in Excel. While Excel saves the changes that you make to files, it does not save the process of that change. Our lab prioritizes making the entire data analysis workflow transparent, and Excel does not allow transparency, so it is not allowed to be a part of our workflow.
To achieve this, we usually have a single R script called something like data_processing.R. This script inputs the raw data and processes it to generate the working data set that will be published with the article.
- Fix some of the problems with data files that occurred at data collection (e.g., fix wrong subject number/date).
- Combine separate subject-specific files into single data set.
- Remove unnecessary columns and rename and reorder existing columns.
- Recode data values.
- Convert dates into ISO if not recorded that way.
- Pivot data into tidy format (if that is appropriate).
- Merge different data files into single file.
Note the only aim of this script is to generate a publication-ready working data set. There should be no analysis conducted in this script. Every statistic in the manuscript should come from the analysis script. While the data processing script does need to be commented and documented, it does not need to be as polished as the analysis script.
6.2.5 Working data
The working data set is the data file (or files) that will be posted with the published article. As such, it needs to be clean and polished. Ideally, there is only a single working data set, so try to merge different data sets together in the data processing script. If that is not possible, multiple working data sets are acceptable, but try to minimize the number of working data sets.
Characteristics of working data sets:
- These files should only include the columns that are relevant to the subsequent data analysis.
- Include dates and times when possible.
- Make sure that the column names are both human and R readable—meaning they are understandable to people but are easy for R to work with (e.g., snake_case).
6.2.6 Data analysis
There should be a single data analysis script for one article manuscript (that will be published with that manuscript). If multiple scripts were created during data analysis, they should be combined into a single script. It should contain the code for all of the analyses in the manuscript. If there are analyses that cannot be run in R, this should be made clear in the manuscript. It should not contain code that is not contained or referenced in the manuscript. Save unused analyses in other scripts.
In general, the analysis script should use the tidyverse system of working with, analyzing, and plotting data. The data analysis script should contain the following in this order:
- A header that includes the name of the script, the purpose of the script, the author(s) of the script, the date that the script was started, the date of the current version of the script, the license under which the script is published, notes on how to run the script, a list of data files, and a description of all of the columns in the data files.
- A list of packages to load at the very beginning of the script. In general, it is recommended to order the scripts alphabetically unless function masking necessitates another order (e.g.,
{here}should go last and{tidyverse}second to last). For packages with a single use or only a few uses, include this in a comment after loading the package. Minimize the number of packages loaded for your script. - A list of custom-coded functions needed for your analysis. Name your function using tidyverse style: “Ideally, the name of your function will be short, but clearly evoke what the function does. … Generally, function names should be verbs, and arguments should be nouns.”
- Import the working data file. If you are using an RStudio project (which you should be!), the
{here}package is useful for setting working directories properly in RStudio. Use theherefunction when setting the path to import your data. - Calculate descriptive statistics of participants/subjects, such as age, gender/sex, and other demographic variables. For human participant studies, this should generate a demographic information table for the supplementary materials.
- Calculate inferential statistics. Typically, we calculate and report frequentist statistics, Bayes factors, and effect sizes. We also report the key means \(\pm\) 95% confidence intervals (either between- or within-subjects) and place the model assumption checks here.
- Plots can either be carved out as a separate section or integrated in with the inferential statistics. Having a separate section is often nice because someone can run the rest of the script without saving new plots, which changes the files and requires them to be staged and updated in the Git commit. Use
{ggplot2}orggplotextension packages to make plots when possible. - Create a separate section at the end for supplemental tables and figures.
High-computation analyses
Sometimes, our analyses can require extensive computations that can take a long time to run. While working through the data analysis, I will often have these scripts write their output to a data file. Then I will comment out the high-computation code and simply import the data file. This will greatly speed up the sourcing of the full R script.
For the final version of the script, however, you will need to uncomment the code and remove the write and read commands. I usually add a comment before the high-computation code warning the user that the code will take a while to process.
6.3 Reproducible research and open science
The lab’s policy is to generate reproducible research—that is, we provide the experimental code, working data, R analysis script, and manuscript file used to generate the final document. This allows other researchers to rerun our studies, rerun our code, or reanalyze our data. While it can be scary to put our work out there for public scrutiny, this is what science is about. It can be uncomfortable to have others scrutinize our work. But the benefits of having someone detect an error and correcting the scientific record is more important than our individual egos. We need to be comfortable saying that we were wrong.
6.3.1 Coding
We should write our code assuming that someone else will be reading it. This is guaranteed to happen when future you revisits the code after taking a break. But we should also assume that a different person will be looking at the code.
Coding principles
- Write the code as concisely and simply as possible.
- Break your code into logical sections. RStudio allows you to create sections in R scripts with
ctrl+shift+R. - Use functions to automate repetitive tasks. As
{tidyverse}author Hadley Wickham recommends, you should write a function if you have to do something three or more times (Wickham and Grolemund 2017). - Use comments a lot and comment as you are writing the code. Don’t wait to comment afterwards. I tend to use comments as subsections to describe conceptually what a block of code does as well as after almost every line to specify the function of that line.
- Use version control to maintain updates of code.
Here are some R-specific coding principles:
- Use
<-as assignment operator. - Use short but descriptive variable names.
- In variable names, separate words with _ or . (e.g.,
my_vector). - Don’t use functions as variable names (e.g.,
c,mean). - Use blank space between all objects, operators (
*,=,==), and after all commas - Write out
TRUEandFALSE. - Use indents to separate nested components. Highlighting text and pressing
ctrl+Iwill automatically indent code properly.
6.3.2 Documentation
In addition to commenting code, documentation is important to maintaining reproducible research.
First, creating and updating a project log is important. The project_log.md file in a project’s admin folder is the best place to start for this (here’s an example project log). The log simply comprises a date and a description of the what happened in the project that day. Entries for these logs can include IRB/IACUC approval dates and protocol numbers, experiment start/pause/stop dates, experiment assistant start/stop dates, anomalous data descriptions (e.g., “program stopped while subject was running, so I restarted it and labelled it subject 102b”). While it may seem tedious, and you may forget to add entries, updating the project log is critical to keep track of issues that may be relevant to data analysis and interpretation, especially months or years after the issues occurred. The project log should be used from the inception of the project, through data collection, data analysis, and manuscript preparation. It can be closed upon final publication.
Second, README files are important for documenting the structure and process of a study project. There is a README.md in the root directory of every project. This file should include the project name and overview, a list of specific aims and research questions, and a project protocol describing the structure of the project and the expectations for working on the project. This should be updated to include the citation and abstract of the accepted manuscript when the project is published. This file is what shows up on the main page of the GitHub repo for the project.
Once a project is ready for submission, there should also be a README.md file added to the reproducible research folder. This file should include the author(s) and creation date of the file, a request for a citation of the manuscript, the license under which the script is published, notes on how to compile the file/run the script, a short summary of the data and data processing, a list of data files, a description of all of the columns in the data files, a list of R scripts.
6.3.3 R Markdown/Quarto
Though it is the worldwide standard and it has some advantages such as track changes, Microsoft Word has limitations for reproducible research because you cannot embed R code into the text to show how statistics are calculated. R Markdown allows the inclusion of R code into manuscripts and can produce beautiful documents. A key benefit of this is that, if your statistics change (because you have altered the R script), you do not have to change them by hand in the document. R Markdown will automatically update them. The standard for the lab is to use R Markdown for all publications. There may be cases in which we do not use R Markdown (e.g., working with collaborators outside of the lab), but it should be the default method for writing manuscripts. And I highly recommend using {papaja} to format APA style manuscripts.
To use R Markdown, you will edit a plain-text .Rmd file that uses Markdown syntax to format text and R code chunks to embed R calculations. In RStudio, you can then compile this file using the {knitr} package to generate a PDF of your document. It takes a bit of time to learn Markdown and R Markdown syntax, but the time invested is worth it to generate elegant, reproducible, updatable manuscripts. You can find example R Markdown files on the lab’s publications page and check out R Markdown: The Definitive Guide (Xie et al. 2018).
Quarto is the next generation of R Markdown. While it’s great for presentation and websites, there currently isn’t a robust template for making APA-formatted journal articles, so I don’t recommend using it for manuscripts just yet.
6.3.4 Dissemination
To disseminate our reproducible research, we must collect all of the relevant files in a cohesive way. Therefore, we need to create a subdirectory in the docs directory called rr or osf or dryad. Within this directory, we need to place the following:
- Data files (
.csvfiles) - R scripts
- R Markdown files for manuscript and supplementary materials
- Bibliography and style files used by R Markdown files
- README file
We usually do not start formally collecting these files until after data analysis and manuscript preparation are complete. But it is important to keep this in mind as you build and work on the project.
Open Science Framework
Once the reproducible research files are in place, they can easily be uploaded to an Open Science Framework (OSF) project, which provides a permanent place to archive the files. OSF projects need to include the major authors as collaborators. The lead author should write a description of the project, choose a license, and add the citation, abstract, and keywords to the project wiki. Then the following components should be added: Data and R script, Figures and tables, and Preprint. Then, upload the data file and R script to Data and R script, primary and supplementary tables and figures to Figures and tables, and the PDF and R Markdown files for the manuscript and supplementary materials to Preprints. Separating the files into different components allows us to (1) allow differential public access and (2) create separate DOIs for different parts. For example,
Figures
When you publish figures in your journal articles or books, the publisher owns the copyright to those figures and may require written permission for others or you to republish them. To avoid this, I recommend publishing the figures yourself first under a license that allows anyone to reuse the figures as long as they cite the source (e.g., Creative Commons Attribution 4.0 International Public License). One way to publish your figures is to create a component in your Open Science Framework project for figures and tables, post your figures and tables there under an appropriate licence, and create a DOI for that OSF component. Then create a citation to this component (e.g., Goh, F. W., Jungck, A. C., & Stevens, J. R. (2020). Payment method effects on tipping: Figures and tables. Open Science Framework. https://doi.org/10.17605/OSF.IO/6FMVS) and add something like the following to the end of each figure caption in your manuscript: “Figure used with permission: Goh et al., 2020; available at https://doi.org/10.17605/OSF.IO/6FMVS under a CC-BY4.0 license”.
Preprints
The lab strives to produce and post preprints of manuscript prior to submission to journals. Posting preprints makes your information public much sooner than waiting for journal publication. While it may seem scary to post your work before it has been peer reviewed, this allows you to get feedback early, gives you credit for work early, and makes your work open and accessible to anyone. You can (and should) update your preprints as changes are made to the manuscript. Check with a journal’s preprint policy before submitting to them. Most journals are fine with preprints (some even allow you to submit to them directly from the preprint server). But some have weird policies. Do not submit your manuscript to journals that do not allow preprints.
For our purposes, there are two primary preprint servers. PsyArXiv focuses on psychology-related content and is associated with the OSF. In fact, you can import files directly from your OSF projects. BioRxiv focuses on biology-related content and has direct connections to many biology journals.